Introduction
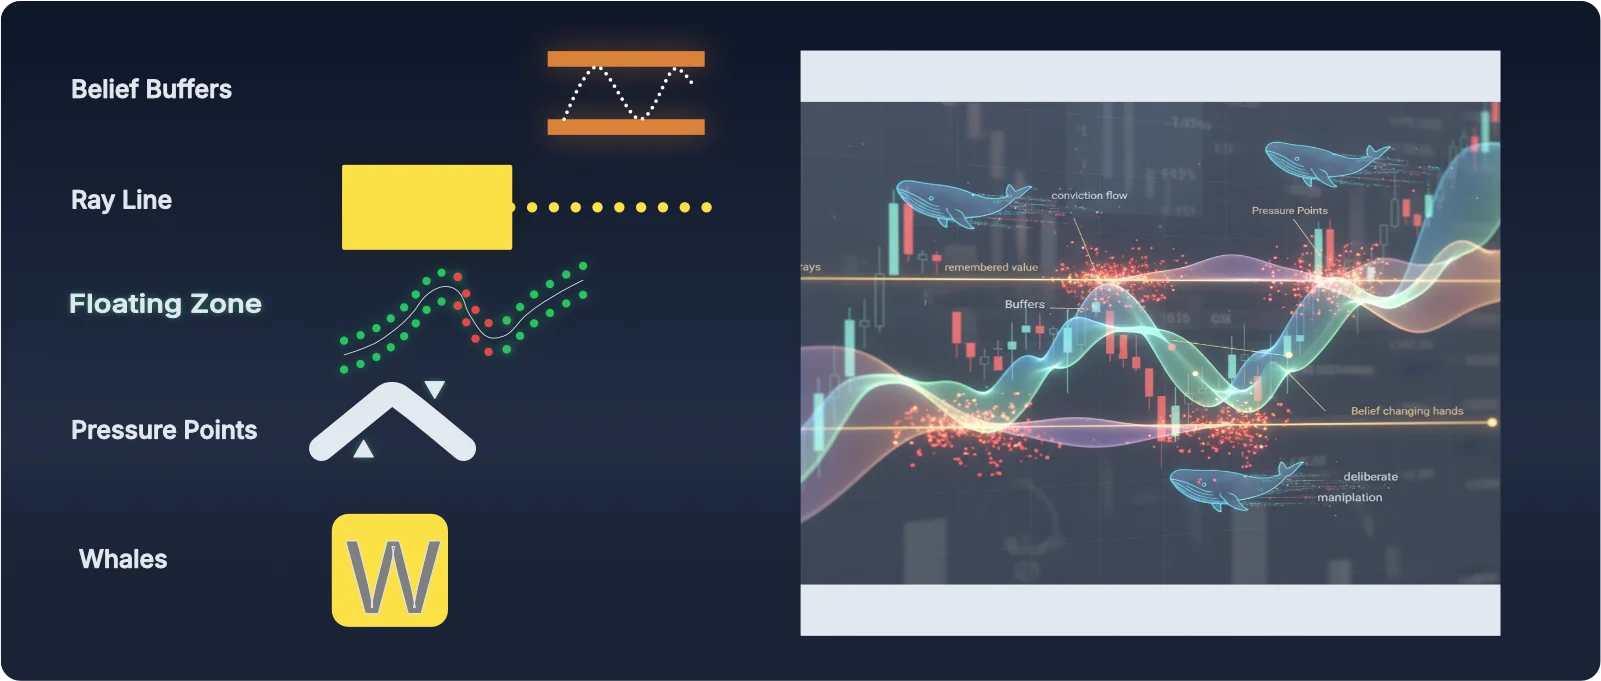
Most traders study candles (the form) and miss belief (the content) that actually moves price. The PAT Indicator reveals belief directly: the River (Floating Zone) shows conviction flow, Rays lines mark a line in the sand ‘tipping points.’ On first forming the beliefs here have yet to harden but harden they will as the move to one side, Pressure Points reveal fractures in consensus, Buffers show belief changing hands, and Whale markers expose deliberate manipulation. Read belief and you’ll stop reacting to traps.
Principle: Form vs. Content
Quickstart: Read a Chart in 20 Seconds
- Find the River: note its slope. Up = strengthening belief; down = weakening belief.
- Locate the nearest Ray: expect a test of remembered conviction.
- Scan for Pressure Points: clusters on one side = belief is cracking.
- Pay attention to Buffers: Look for the challenge to them and remember this is not a challenge of ‘price’ this is a challenge of collective beliefs.
- Whale markers: The name says it all. You are observing large players. It’s just another form of manipulation of price to manipulate BELIEFS and Accumulate / Distribute (off load).
The River — Floating Zone
The Floating Zone is the river of crowd conviction. Its midline is where belief is most at ease; its width adapts to volatility. When the river bends up, buyers’ belief strengthens; when it bends down, that belief unwinds. Price rarely strays far without a cause.

Rays — Lines of Memory
Rays project from completed accumulation boxes. They are not arbitrary lines—they’re memory. When price returns to a ray, it re-tests a place where belief was previously decided. Acceptance above a ray often signals strength; rejection below can signal weakness.

Pressure Points — Cracks in Consensus
Pressure Points (PP) flag where consensus starts to fracture. A cluster on one side of the river is a warning that the dominant view is overextended. PPs are not signals on their own; they are context—tension that can resolve quickly once belief flips.

Tip: PP ≠ Buy/Sell
Buffers — Belief Changing Hands
Buffer zones are shaded areas where old belief fades and new belief forms. Professionals love them because the crowd pays less attention here. Inside buffers, slow down. At buffer exits (with the river and ray agreement), conviction becomes visible.

Whale Markers — Manipulation Made Visible
Whale markers represent deliberate, high-intent activity—often liquidity grabs or institutional positioning. The crowd reads them as confirmation; whales intend them as camouflage. That’s why sharp reversals frequently follow a whale marker. In PAT, whale markers sit at the top of the interpretation hierarchy.

Actionable Priority
Your Market Maker Method Playbook
How to Read and Trade the Signals
Before You Trade: Replay and Narrate
Start every trading session with TradingView's replay function. Here's how it works: click the replay button, scroll back to an earlier point on your chart, then press play. The PAT indicator will move forward bar-by-bar, revealing the historical market action exactly as it unfolded—rays, whales, buffers, and all.
As the chart replays, narrate what you see out loud. Talk through where the market maker is positioned, where manipulation is occurring, what you expect to happen next. Better yet, record yourself doing this. This practice isn't just review—it's calibration. You're tuning your mind into the rhythm and flow of market maker behavior before you risk a single dollar.
This is the most powerful preparation you can do. A static chart shows you where price is now. Replay shows you how it got there and trains your instincts to recognize what comes next. Make this your first step, every session, before you even think about placing a trade.
Trust the 30-60 Second Rule
If nothing immediately stands out, that's your cue to step away—not to search harder. Take a deliberate break: walk away from the screen, stretch, grab a coffee. Your subconscious continues processing what you've seen, and often within 15-20 minutes of returning, the clarity you need will surface naturally. Fresh eyes paired with background mental processing frequently reveal insights that forced analysis never could.
The questions you need to ask and need answers to before placing a trade
1) Where is the nearest whale? Has this played out as a move or is it still pending?
Action: Wait for the first close away from the ray in the new direction. Enter on minor pullback and place stop relevant. (Five min chart is good for this.
Risk Management: (Five min chart is good for this as it gives you a ready made close stop area relative to your entry as it shows pull back)
2) Buffer Exit with PP Cluster
Context: Pressure Point / cluster forms inside / close to buffers; take profits / if just formed consider entry. Aligned with river bend adds weight.
Action: Enter on retest of buffer boundary.
Risk Management: Stop back outside buffer / mindful of potential risk reward. Target another buffer. Be mindful of a new RAY line forming and be ready to take profits / adjust stops. With all trades be mindful of ADR fraction. (Average Daily Range)
3) Ray Line
Context: Acceptance long above a ray while river slopes up (or below while slopes down).
Action: Enter on retest on or close to the ray from the accepted side. (flow)
Risk Management: Invalidation / challenge is a movement back through the ray line under/over river.
Keep these playbook steps as your foundation. These are your guiding principles. These principles are fundamental and do not change. What does change is your experience over time and your intuitive understanding of what you’re doing and how you’re interacting with the market maker’s business model. When you know, you know. That is a time when you bend the guiding principles to take immediate advantage of opportunity.
Risk, Timing & Execution
- Confirm on Close: PAT’s core signals align to confirmed bars; avoid impulsive early entries.
- Respect ADR: If most of the daily range is done, trim expectations or stand aside.
Single most powerful base line for trading the market makers method
- Enter on a confirmed single belief premise about the future.
- Exit when the premise becomes truth. (Win)
- Exit the moment the premise would no longer be valid if your were not currently in the market or that premise destroyed.
FAQ & Glossary
- Floating Zone (River): The adaptive belief midline + upper and lower lanes
- Ray: Projected midline from a completed accumulation box - pivotal belief line
- Pressure Point: Triangle-based marker signaling belief fractures.
- Buffer: Shaded zone where belief changes hands.
- Whale Marker: High-intent activity; often the end of manipulation and start of the true move.